Shadow AI is not a single product problem. It is a visibility problem across identity, source code, network traffic, cloud control planes, endpoints, and SaaS applications.
Most organizations already have AI usage inside the business before there is a complete AI governance program. A developer tests an SDK. A team connects a meeting assistant to Google Workspace. A build job starts summarizing pull requests. A product workflow adds embeddings and a vector database. A security analyst installs a local MCP server. A business user pastes customer context into a browser-based assistant.
Some of that usage is useful and should be approved. Some of it creates real data exposure, vendor, privacy, intellectual-property, and operational risk. The difficult part is that the same signal can mean very different things depending on the surrounding system.
The practical question is not: "Do employees use AI?"
They do.
The useful question is: which identities, repositories, workloads, tools, and data paths are participating in AI systems, how confident is the evidence, and what should be reviewed first?
This is the problem we have been working through with customers. Shadow AI is not solved by a keyword list. It requires evidence engineering.
Why Shadow AI Is Technically Hard
Traditional SaaS discovery assumes there is a relatively clear object to inventory: an application, a vendor, a login, a browser destination, or an OAuth grant.
AI usage breaks that model.
An AI system may include:
- A model provider such as OpenAI, Anthropic, Gemini, Bedrock, Cohere, Mistral, or Hugging Face.
- A broker or gateway such as OpenRouter, Helicone, LangSmith, Langfuse, Braintrust, or an internal model router.
- Source code using SDKs, model IDs, prompt templates, embedding APIs, or agent frameworks.
- MCP servers exposing filesystems, browsers, databases, SaaS tools, or internal commands.
- Vector databases such as Pinecone, Qdrant, Weaviate, Chroma, Milvus, pgvector, Redis, OpenSearch, or Elasticsearch.
- CI/CD jobs that send source code, test failures, pull request diffs, or release notes to an AI tool.
- SaaS OAuth grants that give an AI application access to email, documents, calendars, Drive, or admin data.
- Network traffic to model APIs, artifact registries, inference endpoints, or internal AI services.
- First-party AI usage inside Workspace, Microsoft 365, cloud platforms, IDEs, ticketing systems, or security tools.
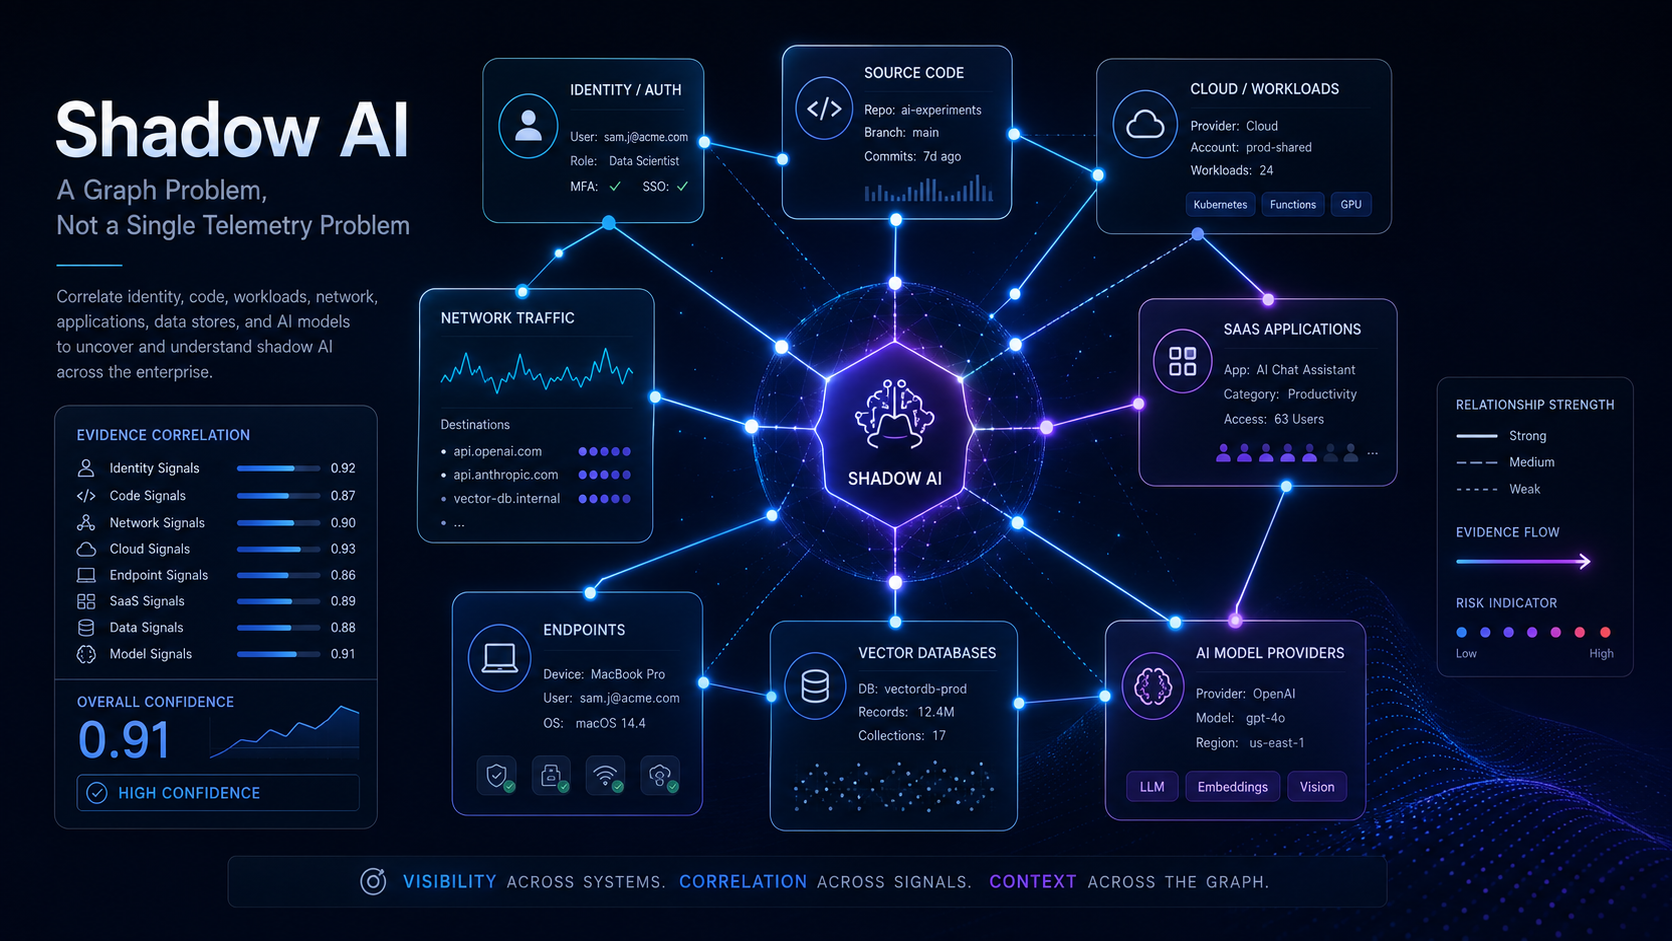
That means shadow AI is not a single telemetry problem. It is a graph problem.
The unit of analysis is not just an app name. It is:
identity + tool + authorization + code path + workload + destination + data access + recurrence + owner + confidence
If that graph is incomplete, security teams either understate risk or overstate it. Both are bad outcomes. Understatement lets sensitive data flow into unmanaged tools. Overstatement creates noisy governance findings that engineering and business teams stop trusting.
The Core Evidence Problem
The main technical challenge is that no single log source answers the full question.
Google Workspace can show that a user authorized an AI-like OAuth app and what scopes were requested. It usually cannot prove what content was sent to that app.
Git can show that a repository contains AI SDKs, prompts, MCP configuration, model IDs, vector-store clients, or CI/CD AI usage. It cannot prove that the code is deployed or currently running.
VPC Flow Logs can show that a workload connected to AI-adjacent infrastructure, vector database ports, internal inference services, package registries, or model artifact sources. They cannot show prompts, HTTP paths, model names, or SDK user agents.
CloudTrail can show Bedrock invocation events, IAM changes, service usage, and control-plane behavior. It may not show third-party SaaS AI usage outside the cloud account.
Endpoint telemetry can show local tools, spawned processes, browser extensions, IDE plugins, MCP servers, and command-line usage. It may not preserve the business context or the data that was accessed.
Proxy, DNS, and CASB logs can show destinations, domains, users, and sometimes HTTP metadata. They often miss code-level intent, internal services, and cloud-native model usage.
This creates a recurring customer pattern: each telemetry source is incomplete, but each can raise or lower confidence when joined with the others.
The right output is not a binary label like "AI" or "not AI." The right output is a confidence-rated finding with evidence, limits, and next validation steps.
What Counts As Shadow AI
We use a broad definition because AI risk often appears before a model API call is obvious.
Confirmed shadow AI may include:
- A user granting OAuth access to a known AI assistant with Gmail or Drive scopes.
- Source code that imports an AI provider SDK and constructs a model client.
- A CI workflow that uses an AI API key to summarize pull requests.
- CloudTrail events showing Bedrock
InvokeModel,Converse, or related model-runtime activity. - A workload repeatedly connecting to known model-provider domains with matching DNS evidence.
- An MCP configuration exposing local files, browser automation, database access, or SaaS tools.
Probable shadow AI may include:
- AI-related dependencies without direct usage found in scanned files.
- Prompt templates, eval datasets, or model configuration without runtime evidence.
- Network connections to AI provider IPs based on current DNS attribution only.
- Traffic to vector database ports from application workloads.
- Access-evaluation events showing app-control decisions around AI-like tools.
Weak shadow AI signals include:
- Generic terms such as
agent,assistant,studio, orautomation. - Documentation-only mentions.
- Dependency remnants after code removal.
- Current DNS matches without historical resolver evidence.
- Vendor names in comments without executable code or configuration.
Weak signals still matter. They belong in a review queue, not in an executive finding. The difference is evidence quality.
Why Authorization Is Often The First Useful View
For many customers, the first reliable shadow AI trail appears in identity and SaaS authorization logs.
Google Workspace, Microsoft Entra, GitHub, Slack, Notion, Atlassian, and other collaboration platforms are where users connect AI tools to business data. A user may not deploy an application, but they can still authorize an AI meeting assistant, writing tool, coding assistant, research tool, or automation service with access to sensitive workspaces.
The technical risk is not only that the app is AI. The risk is what the app can reach.
High-risk authorization patterns include:
- Gmail read, send, modify, or full mailbox scopes.
- Broad Drive, Docs, Sheets, or Slides read/write scopes.
- Calendar read/write access for meeting intelligence tools.
- Admin SDK or directory scopes.
- Source-code repository read access.
- Workspace automation scopes that can move data between systems.
- Long-lived grants without owner, approval, or current control validation.
Authorization evidence answers concrete questions:
- Which users enabled the tool?
- Which client ID or app was authorized?
- What scopes were requested or granted?
- Was the app trusted, limited, blocked, exempt, or unconfigured?
- Did admin policy change before or after the usage?
- Is the current console state consistent with historical logs?
This is why we treat OAuth and app-access evidence as a first pillar, not as a complete solution.
Why Git Is Often The Earliest Engineering Signal
Git shows intent before runtime telemetry becomes obvious.
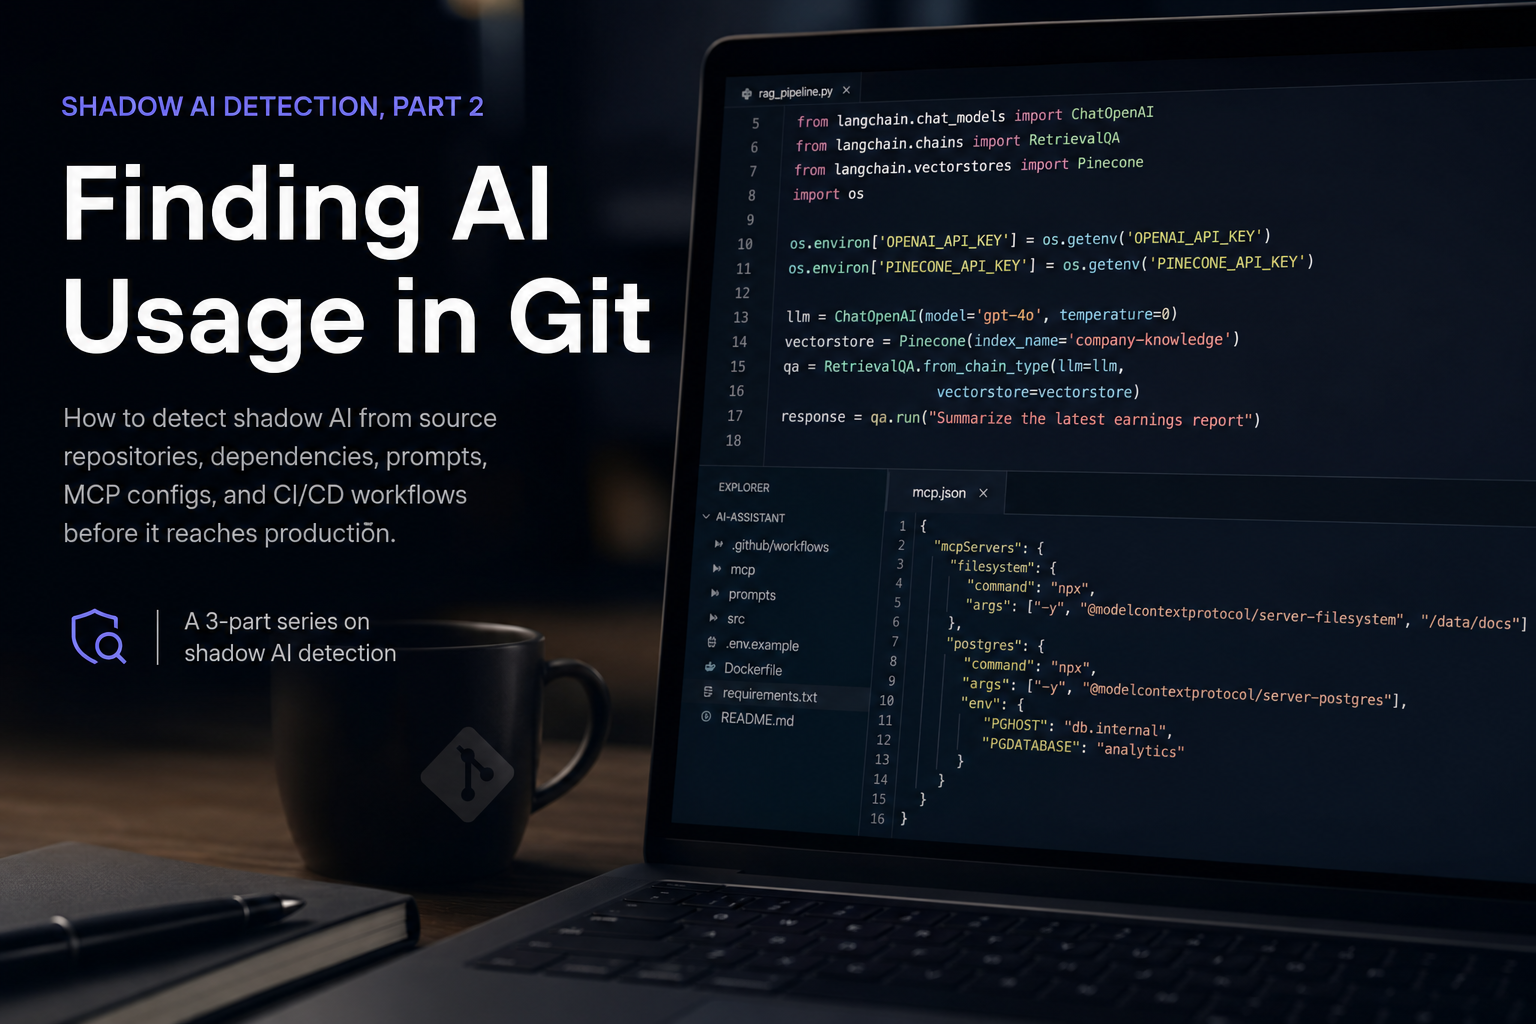
Repositories reveal:
- AI provider SDK imports.
- Model routing configuration.
- Prompt templates and system prompts.
- RAG pipelines and embedding code.
- Vector database clients.
- MCP server definitions.
- Agent framework usage.
- AI-related environment variable names.
- CI/CD jobs using AI tools.
- Eval, fine-tuning, and benchmark artifacts.
This evidence is valuable because it maps AI usage back to files, owners, teams, and review paths. If a customer asks "where are we building with AI?", Git often provides a better starting point than network logs.
But Git evidence has to be interpreted carefully. A dependency is not the same as runtime usage. A prompt file is not the same as production exposure. An MCP config is not necessarily running. A model ID in a test fixture is not automatically a production data path.
The useful output is a repository-level inventory:
- Evidence category.
- File path and line number.
- Provider or framework.
- Data or tool exposure.
- Runtime likelihood.
- Owner.
- Validation path.
That turns shadow AI from a vague policy question into an engineering review queue.
Why Network Behavior Completes The Picture
Some AI usage will never show up cleanly in SaaS authorization logs or source scans.
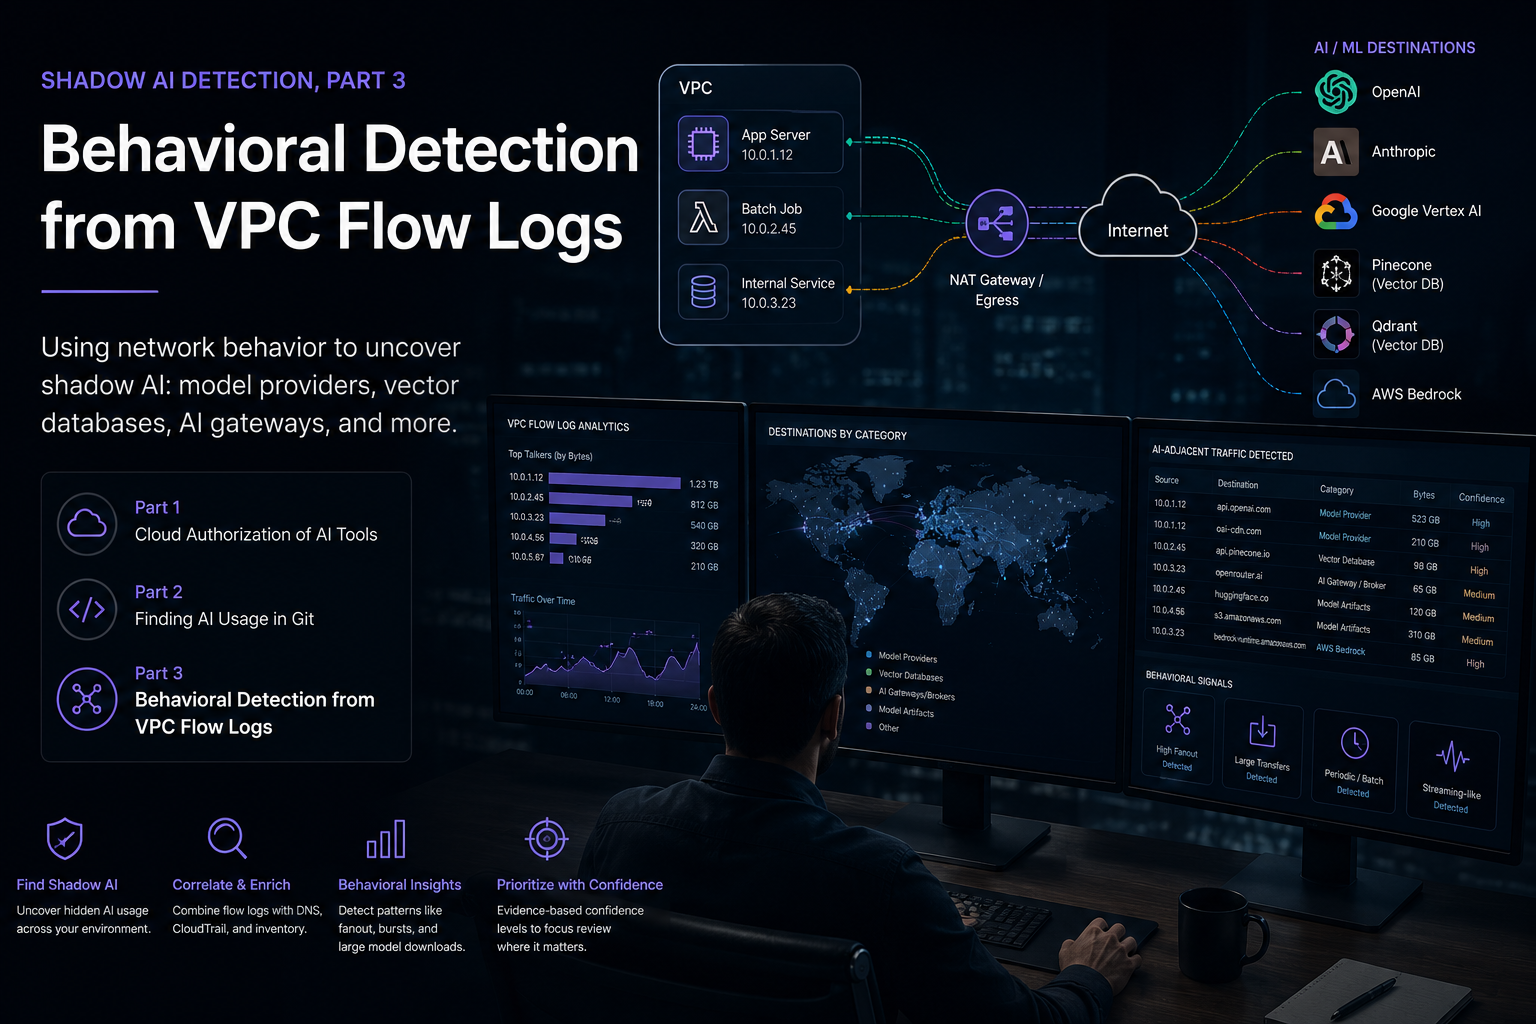
An internal service may talk to a model gateway. A container may download a model artifact. A workload may connect to a vector database. A NAT gateway may carry AI traffic for several applications. A batch job may call a provider API from an environment nobody documented. A cloud-native service may use Bedrock without any third-party SaaS trail.
Network metadata helps detect that runtime behavior.
VPC Flow Logs, DNS, proxy logs, and workload inventory can answer:
- Which workloads reached AI-adjacent destinations?
- Which sources had first-seen AI egress?
- Which internal services look like AI gateways?
- Which workloads talk to vector databases or inference ports?
- Which destinations are model providers, brokers, artifact sources, or observability tools?
- Which egress paths need better attribution?
- Which traffic patterns look like batch embeddings, streaming inference, model downloads, or agent fanout?
Flow logs alone do not prove prompt content. They do not identify LangChain, LlamaIndex, or a specific SaaS model. They do not always identify the user behind a workload.
But when joined with DNS, CloudTrail, Git, tags, EKS metadata, ECS metadata, proxy logs, and OpenTelemetry, they can turn vague outbound traffic into an AI systems graph.
The Three Practical Detection Views
We have been turning this work into three repeatable technical approaches:
- Cloud authorization detection: OAuth grants, app access controls, Workspace AI usage, Drive exposure, and current-state validation.
- Git-based AI detection: SDKs, prompts, MCP configs, dependencies, RAG, vector stores, CI/CD usage, and AI supply-chain evidence.
- Network behavioral detection: VPC Flow Logs, DNS, CloudTrail, workload inventory, vector databases, model brokers, internal gateways, and traffic-shape analysis.
Each view is incomplete by itself. Together, they form a practical MDR workflow for shadow AI.
What Good Looks Like
A good shadow AI program does not start by blocking everything. It starts by making the hidden system visible.
The target state is an inventory that can answer:
- Which AI tools and providers are in use?
- Which users, repos, workloads, and teams are involved?
- Which data sources or scopes are reachable?
- Which usage is first-party, approved, unapproved, or unknown?
- Which paths bypass approved gateways?
- Which systems combine AI with sensitive data access?
- Which findings are confirmed, probable, or weak?
- Which controls should be changed now?
- Where do we need better telemetry?
That is the actual shadow AI problem. It is not that AI exists in the business. It is that AI creates new data paths faster than traditional inventory, approval, and detection workflows can represent them.
The answer is not only policy. The answer is evidence: authorization evidence, source evidence, runtime behavior, ownership, confidence, and limits.
Once that evidence is reliable, governance becomes practical. Security can approve the good uses, contain the risky ones, and monitor the systems that matter.