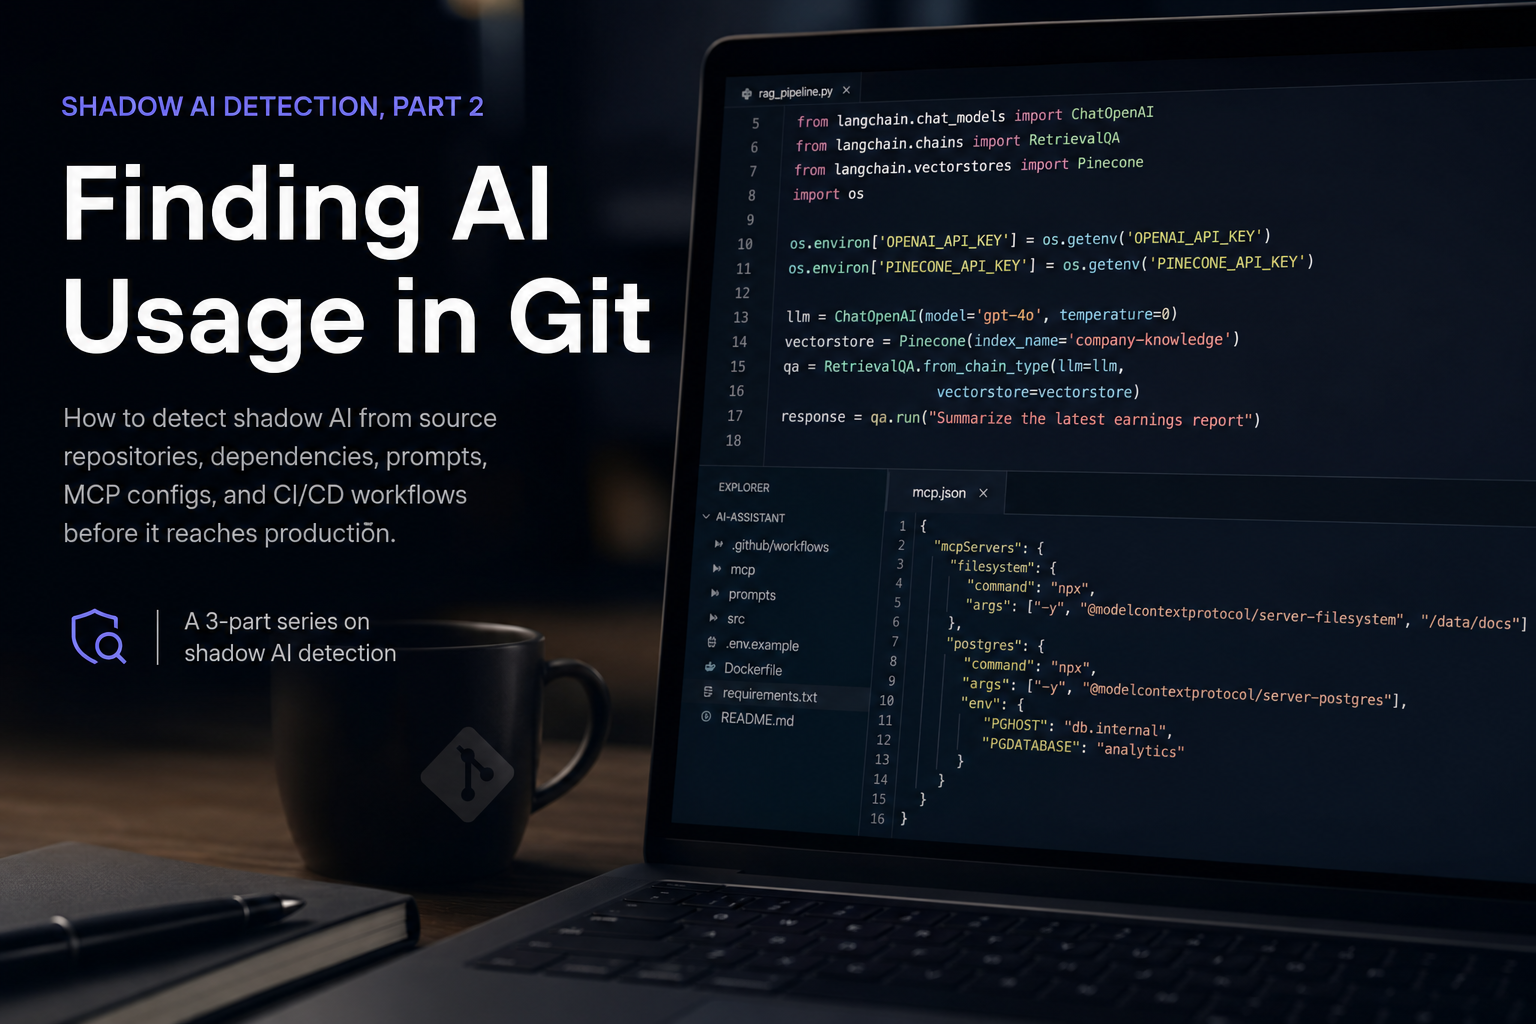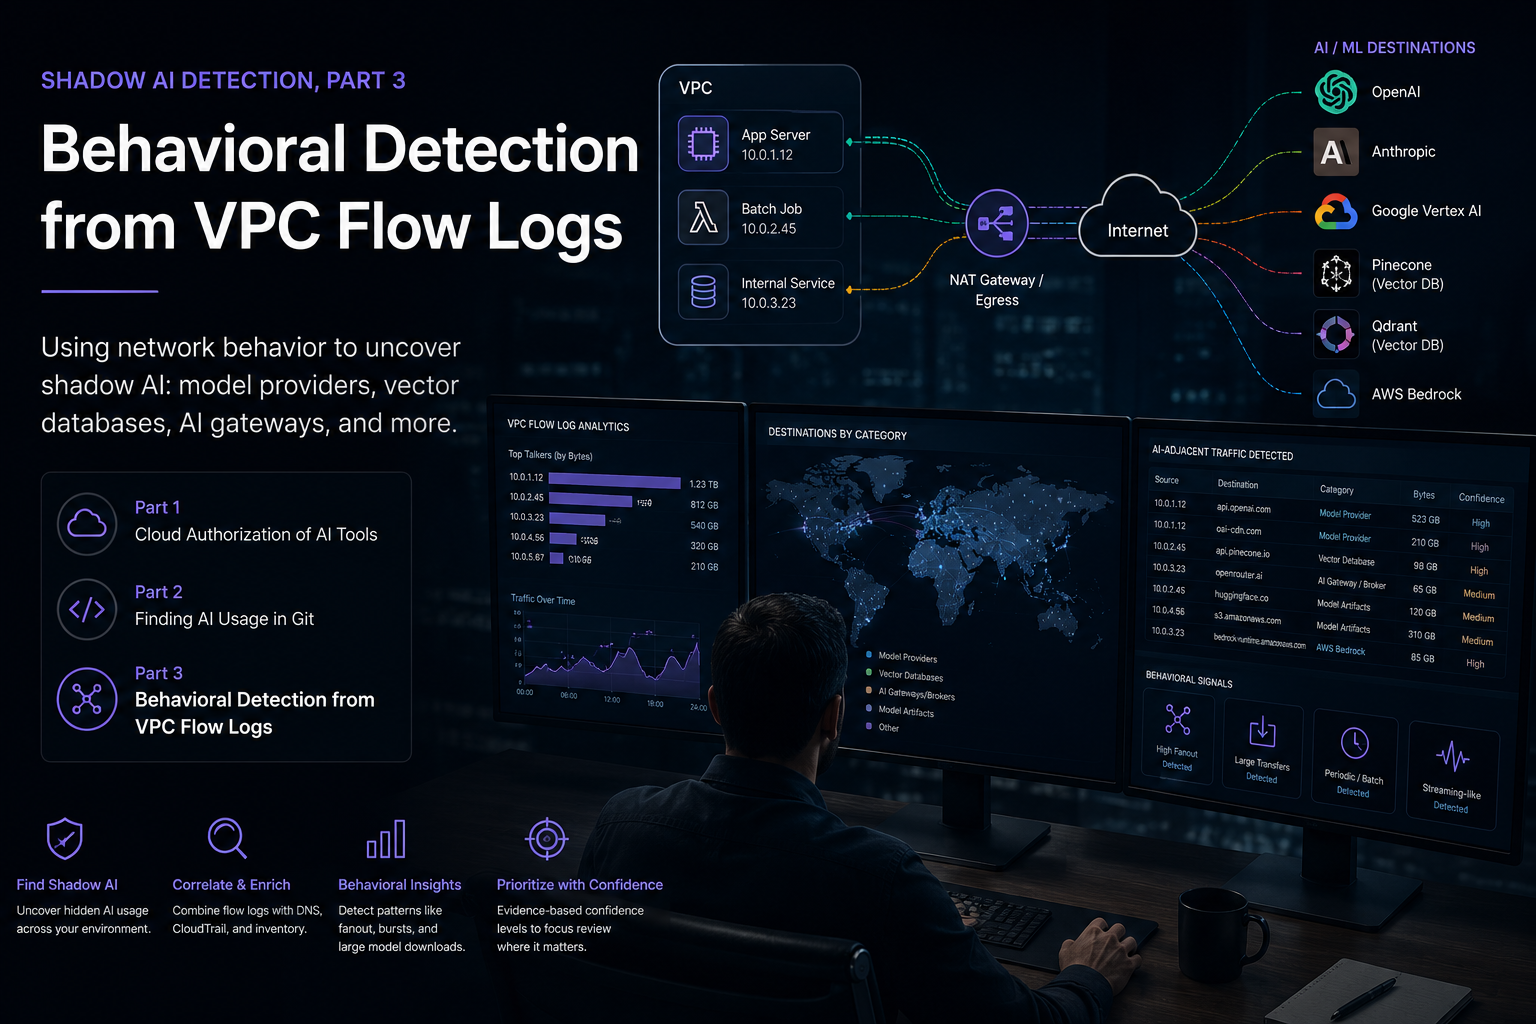
This is part 3 of a three-part series on shadow AI detection. It focuses on behavioral evidence: workloads, destinations, egress paths, byte patterns, and the correlation needed to turn network metadata into an AI usage map.
- Part 1: Cloud Authorization of AI Tools
- Part 2: Finding AI Usage in Git
- Part 3: Behavioral Detection from VPC Flow Logs
Open-Source Skills
AI usage is not always visible first in source code or identity logs. Sometimes the first evidence is network behavior: a workload starts making HTTPS connections to a model provider, a batch job begins writing to a vector database, a GPU node downloads large model artifacts, or an internal service becomes a shared AI gateway for several callers.
VPC Flow Logs are not payload logs. They do not show prompts, HTTP paths, headers, model names, or SDK user agents. But they do show enough metadata to build a strong shadow-AI discovery workflow when combined with DNS, CloudTrail, workload inventory, and behavioral features.
For MDR and security teams, the practical question is not “can flow logs prove every AI detail?” They cannot. The useful question is: which workloads talked to AI-adjacent destinations, how often, with what byte and packet shape, through which egress path, and what evidence is needed to raise confidence?
This post describes a reusable VPC Flow Log approach for detecting shadow AI, RAG, vector databases, model brokers, internal inference servers, model downloads, Bedrock usage, and agent-like behavior. It converts field investigation logic into open-source Claude/Codex skills.
Why VPC Flow Logs Are Useful For AI Detection
VPC Flow Logs provide aggregate network records. A typical record includes:
- Source address.
- Destination address.
- Source and destination ports.
- Protocol.
- Packets.
- Bytes.
- Start and end timestamps.
- Action.
- Log status.
- Interface ID.
With a custom format, the records can also include:
- VPC ID.
- Subnet ID.
- Instance ID.
- Packet source and destination addresses.
- Flow direction.
- Traffic path.
- TCP flags.
- Region and availability zone metadata.
Those fields do not reveal content, but they are enough to answer high-value MDR questions:
- Which workloads reached known model-provider destinations?
- Which workloads reached vector databases or internal inference ports?
- Which sources had new AI-adjacent egress?
- Which sources had high fanout patterns that look agentic?
- Which sources downloaded large model artifacts?
- Which internal service may be acting as an AI gateway?
- Which NAT or proxy path needs deeper attribution?
- Which Bedrock events need CloudTrail model attribution?
The key is to avoid treating destination IP alone as the whole story. The useful unit is:
source workload + destination identity + timing + byte/packet shape + recurrence + corroborating telemetry
That is how flow logs become an AI systems graph rather than a list of IPs.
What VPC Flow Logs Can And Cannot Prove
VPC Flow Logs can support findings such as:
- A workload connected to infrastructure currently resolving from a known AI provider domain.
- A workload connected to internal ports commonly used by vector databases or inference servers.
- A workload repeatedly contacted package registries or model artifact sources.
- A workload had high fanout around model-provider traffic.
- A workload showed batch-like, embedding-like, streaming-like, or heartbeat-like behavior.
- A NAT gateway or egress path carried AI-adjacent traffic.
VPC Flow Logs cannot prove:
- Prompt or response content.
- Exact SaaS model name.
- HTTP path or method.
- Request body size versus response body size unless direction-specific logs are available.
- TLS SNI.
- SDK, library, or framework name.
- Whether LangChain, LlamaIndex, or a raw SDK generated the traffic.
- Exact user identity behind an application request.
- Which workload is behind NAT unless packet-source fields or inventory joins preserve the original source.
This is why a reusable skill should produce confidence-labeled evidence rather than binary conclusions.
The Detection Model
The VPC detection model separates evidence into categories and confidence levels.
Foundation Model Provider Traffic
This is traffic to known model-provider infrastructure, such as:
- OpenAI.
- Anthropic.
- Google Gemini or Vertex AI.
- Cohere.
- Mistral.
- Together.
- Groq.
- Fireworks.
- Perplexity.
- DeepSeek.
- Voyage.
- Jina.
- Replicate.
- Hugging Face inference endpoints.
Flow logs usually contain IPs, not domains. Provider matching is strongest when historical DNS or proxy logs show that a source resolved a provider domain and then connected to the resolved IP in the same time window.
Current DNS resolution is useful but weaker. SaaS IPs change, CDNs move, and shared infrastructure can create false attribution if DNS history is missing.
Model Brokers And Gateways
Shadow AI often reaches a broker rather than a model provider directly. Useful destinations include:
- OpenRouter.
- Helicone.
- LangSmith.
- Langfuse.
- Braintrust.
- Weights & Biases.
- Internal AI gateways.
- Custom model routers.
Broker traffic is important because it can hide the downstream model provider. If an internal service talks to OpenAI, Anthropic, or Bedrock while many application services talk only to that internal service, the internal service may be an AI gateway.
The useful pattern is:
caller service -> internal gateway -> model provider
Attribution should propagate backward carefully. The caller may be an indirect AI user even if it never talks to a public provider directly.
RAG And Vector Database Traffic
RAG systems often show up in VPC Flow Logs because vector stores and retrieval systems have distinct network paths.
External vector destinations include:
- Pinecone.
- Qdrant Cloud.
- Weaviate Cloud.
- Zilliz or Milvus Cloud.
- Chroma Cloud.
- MongoDB Atlas vector search.
- Supabase vector use.
Internal vector-capable systems include:
- Postgres with pgvector on
5432. - Redis vector-capable deployments on
6379. - OpenSearch or Elasticsearch on
9200. - Qdrant on
6333or6334. - Milvus on
19530. - Weaviate-like services on
8080.
An internal port match is not proof of RAG. It is a candidate. It becomes much stronger when the same source also reaches a model provider, embedding provider, document store, object store, or prompt-serving application.
Internal Inference Services
Local or open-source model use may not call a public provider at inference time. Flow logs can still reveal the architecture.
Common internal inference signals include:
- Many application services connecting to one private IP on
8000or8080. - Ollama-style traffic on
11434. - Triton-style traffic on
8000,8001, or8002. - Model-serving containers receiving sustained internal traffic.
- GPU nodes downloading large artifacts from Hugging Face, GitHub releases, S3, ECR, or container registries during startup.
The pattern to look for is:
model artifact download -> internal inference node -> many internal callers
Flow logs alone do not show GPU use. Join with compute inventory, CloudWatch metrics, EKS/ECS task metadata, or SageMaker inventory to raise confidence.
Package And Model Artifact Sources
Traffic to package registries is supporting evidence:
- PyPI.
- files.pythonhosted.org.
- npm registry.
- Docker Hub.
- GHCR.
- GitHub release assets.
- Hugging Face.
- ECR.
- S3 model buckets.
Registry traffic is common and not proof of AI usage. It becomes useful when it occurs at workload start, shortly before provider calls, vector writes, or internal inference traffic.
DNS Correlation Is The First Big Upgrade
Raw flow logs show IPs. AI providers are usually identified by domains. DNS correlation bridges that gap.
The preferred chain is:
- Route 53 Resolver query log shows source resolving
api.anthropic.com. - Resolver answer includes one or more IPs.
- Flow log shows the same source connecting to one of those IPs on
443. - Timing aligns within a short window.
That raises confidence from “current DNS says this IP may belong to Anthropic” to “this workload resolved Anthropic and then connected to the resolved address.”
Current DNS is still useful for discovery, but historical DNS is better for evidence.
Bedrock Requires A Different Approach
AWS Bedrock usage may not appear as traffic to a public SaaS provider. It can use AWS endpoints, private networking, or VPC endpoints.
For Bedrock, the best evidence comes from joining:
- VPC Flow Logs showing source workload traffic to a Bedrock endpoint path.
- VPC endpoint inventory.
- CloudTrail events such as
InvokeModel,InvokeModelWithResponseStream,Converse, andConverseStream. - IAM principal.
- Region.
- Model ID from request parameters when available.
Flow logs answer:
- Which source used the endpoint path?
- When did it happen?
- How much traffic moved?
CloudTrail answers:
- Which Bedrock API was called?
- Which principal called it?
- Which model ID was requested?
- Which region and account were involved?
Bedrock findings should be high confidence when CloudTrail model invocation events are present.
Timing, Packets, And Byte Shape
The most useful part of VPC Flow Logs is often not the destination. It is the behavior shape.
Useful derived features include:
- Average packet size:
bytes / packets. - Flow duration:
end - start. - Bytes per second.
- Packets per second.
- Flow count per source per minute.
- Unique destination count.
- Hourly recurrence.
- Burstiness.
- Fanout.
- Co-occurrence between model providers, vector stores, package registries, and data systems.
These features help distinguish different AI behaviors.
Chat Completion
Chat-style calls usually show:
- HTTPS to a model provider.
- Short to medium duration.
- Moderate packets and bytes.
- Irregular timing aligned with application traffic.
Flow logs cannot see the prompt or completion, but they can show request cadence and provider path.
Streaming Chat
Streaming can show:
- Longer flow duration.
- More packets.
- Sustained traffic.
- Fewer but longer-lived connections.
This is not token-level evidence. It is a shape that should be validated with application or gateway logs.
Embeddings
Embedding pipelines often show:
- Many repetitive short flows.
- Similar byte sizes.
- Higher outbound text volume where direction is available.
- Co-occurrence with vector DB writes.
- Scheduled or batch-like execution.
If flow logs show embedding provider calls followed by Pinecone, Qdrant, OpenSearch, or Postgres vector writes, the confidence of a RAG indexing pipeline rises.
Reranking
Reranking often appears between retrieval and generation:
- Vector search.
- Reranker API call.
- Model provider call.
The sequence matters more than any single destination.
Agent Workflows
Agent-like systems have a different rhythm:
- LLM call.
- Tool/API call.
- LLM call.
- Search/SaaS/internal API call.
- LLM call.
In flow logs, this looks like high fanout and alternating destination categories from the same source within a short window.
Signals include:
- Multiple model-provider flows.
- Many distinct destinations.
- Repeated short flows.
- Serial gaps rather than one large batch.
- Tool destinations such as search, GitHub, ticketing, messaging, browser automation, or internal APIs.
Flow logs cannot prove the framework. They can suggest agent-like behavior.
Eval Harnesses
Eval or benchmark jobs often show:
- Many similar calls.
- Multiple providers.
- Regular cadence.
- Observability or eval backend traffic.
- Off-hours execution.
This can look like a model router or fallback system. The distinction requires source code, logs, or owner validation.
Heartbeats
Heartbeat or telemetry traffic should not be overcalled as AI usage.
Heartbeat-like traffic often has:
- Very small bytes.
- Very few packets.
- Fixed intervals.
- Low byte variance.
- No data-store or vector-store co-occurrence.
A useful detector should preserve heartbeat context but avoid turning it into a high-severity finding.
NAT And Egress Attribution
NAT can collapse many sources into one egress identity. If the logs only show NAT gateway source addresses, the finding should be reported as egress-path evidence, not workload evidence.
Better attribution requires:
pkt-srcaddrandpkt-dstaddr.- NAT Gateway flow log fields that preserve original packet addresses.
- ENI-to-workload inventory.
- ECS task, EKS pod, Batch job, or EC2 instance metadata.
- Proxy or gateway logs.
The reporting rule is simple:
If attribution is weak, say “this egress path carried AI-adjacent traffic.” Do not name an application owner until inventory supports it.
The Reusable Skill Layout
The implementation is split into two skills so detection and reporting remain separate.
aws-vpc-flow-shadow-ai-detection
This skill analyzes VPC Flow Logs from either CloudWatch Logs or an offline normalized CSV export.
The analyzer writes:
flow-summary.csvai-candidate-flows.csvworkload-ai-summary.csvhourly-top-destinations.csvai-domain-resolution.csvbedrock-cloudtrail-events.jsonraw-query-manifest.json
The offline CSV mode is important for testing and for customer-provided evidence bundles where live cloud access is unavailable.
aws-vpc-flow-ai-security-report
This skill turns analyzer outputs into a security report.
It writes:
vpc_flow_ai_security_report.mdvpc_flow_ai_security_report_summary.jsonvpc_flow_ai_security_findings.csvvpc_flow_ai_priority_findings.csvvpc_flow_ai_provider_findings.csvvpc_flow_ai_rag_agent_findings.csvvpc_flow_ai_limitations.csv
The report separates provider-path evidence, RAG/vector candidates, internal inference signals, Bedrock attribution, and limitations.
Recommended Weekly Workflow
A practical weekly workflow looks like this:
- Define the analysis window.
- Confirm flow-log format and aggregation interval.
- Collect or load flow records.
- Resolve AI endpoint catalog domains.
- Enrich destinations with current DNS, PTR, and any historical DNS evidence.
- Join ENI and workload inventory where available.
- Run flow classification.
- Score workloads.
- Check Bedrock CloudTrail events.
- Build the report.
- Validate low-confidence internal port findings with owners.
- Correlate high-priority findings with Git, CloudTrail, identity, proxy, and application logs.
The key operational discipline is to report what the evidence proves and what telemetry is needed next.
Prioritization Model
High-priority findings include:
- Foundation-model provider traffic from production workloads.
- Model broker traffic from shared internal services.
- Provider traffic bypassing an approved AI gateway.
- Bedrock model invocation without expected controls.
- Model-provider traffic from workloads with access to sensitive databases or object stores.
- Vector database traffic plus model-provider traffic from the same source.
- Internal inference ports with many callers.
- Large model artifact downloads followed by internal inference traffic.
- LLM observability or eval traffic from unapproved workloads.
Medium-priority findings include:
- Internal vector-like ports without provider traffic.
- Package or model registry traffic near job startup.
- Unattributed NAT egress to AI-adjacent destinations.
- Current DNS-only endpoint matches without historical DNS.
- Agent-like fanout without confirmed model-provider traffic.
Low-priority findings include:
- Heartbeat-like traffic.
- Internal app ports with no AI corroboration.
- Registry traffic without AI package or model context.
- Current PTR-only hints with no timing correlation.
Reporting Language That Avoids Overclaiming
Precise language matters. Recommended phrasing:
- “The flow logs show traffic from this source to infrastructure currently associated with a model provider.”
- “Current DNS-based attribution is medium confidence and should be validated with historical Resolver or proxy logs.”
- “The source contacted an internal port commonly used by vector or inference services; inventory validation is required.”
- “CloudTrail shows Bedrock invocation events and provides the strongest model-attribution evidence.”
- “The traffic pattern is consistent with RAG or agent-like behavior, but flow logs alone do not identify the framework.”
- “NAT attribution is incomplete; the source should be treated as an egress path until packet-source fields or inventory are joined.”
Avoid unsupported phrasing such as:
- “This prompt was sent to the provider.”
- “The exact model was used” for SaaS providers without model telemetry.
- “Data was exfiltrated.”
- “This is LangChain traffic.”
- “This workload is the source” when the source is a NAT gateway.
- “No shadow AI exists.”
VPC Flow Logs are evidence of network behavior. They become stronger when joined with the right telemetry.
How VPC Evidence Correlates With Other Sources
Flow findings become much more valuable when joined to other evidence:
- Git shows
qdrant-client; flow logs show internal Qdrant-like traffic. - Git shows an OpenAI SDK; flow logs show provider egress from the same service.
- CloudTrail shows Bedrock
Converse; flow logs show traffic to a Bedrock endpoint path. - Route 53 Resolver logs show
api.anthropic.com; flow logs show a matching connection seconds later. - EKS metadata maps a source IP to a pod and namespace.
- ECS task metadata maps an ENI to a service and image.
- Proxy logs reveal HTTP host, path, method, and user agent.
- OpenTelemetry spans reveal model name, prompt template, tool calls, and token counts.
- Billing spikes identify candidate windows for flow review.
This correlation is how a reviewer moves from “possible AI network path” to “probable AI system” or “confirmed runtime AI usage.”
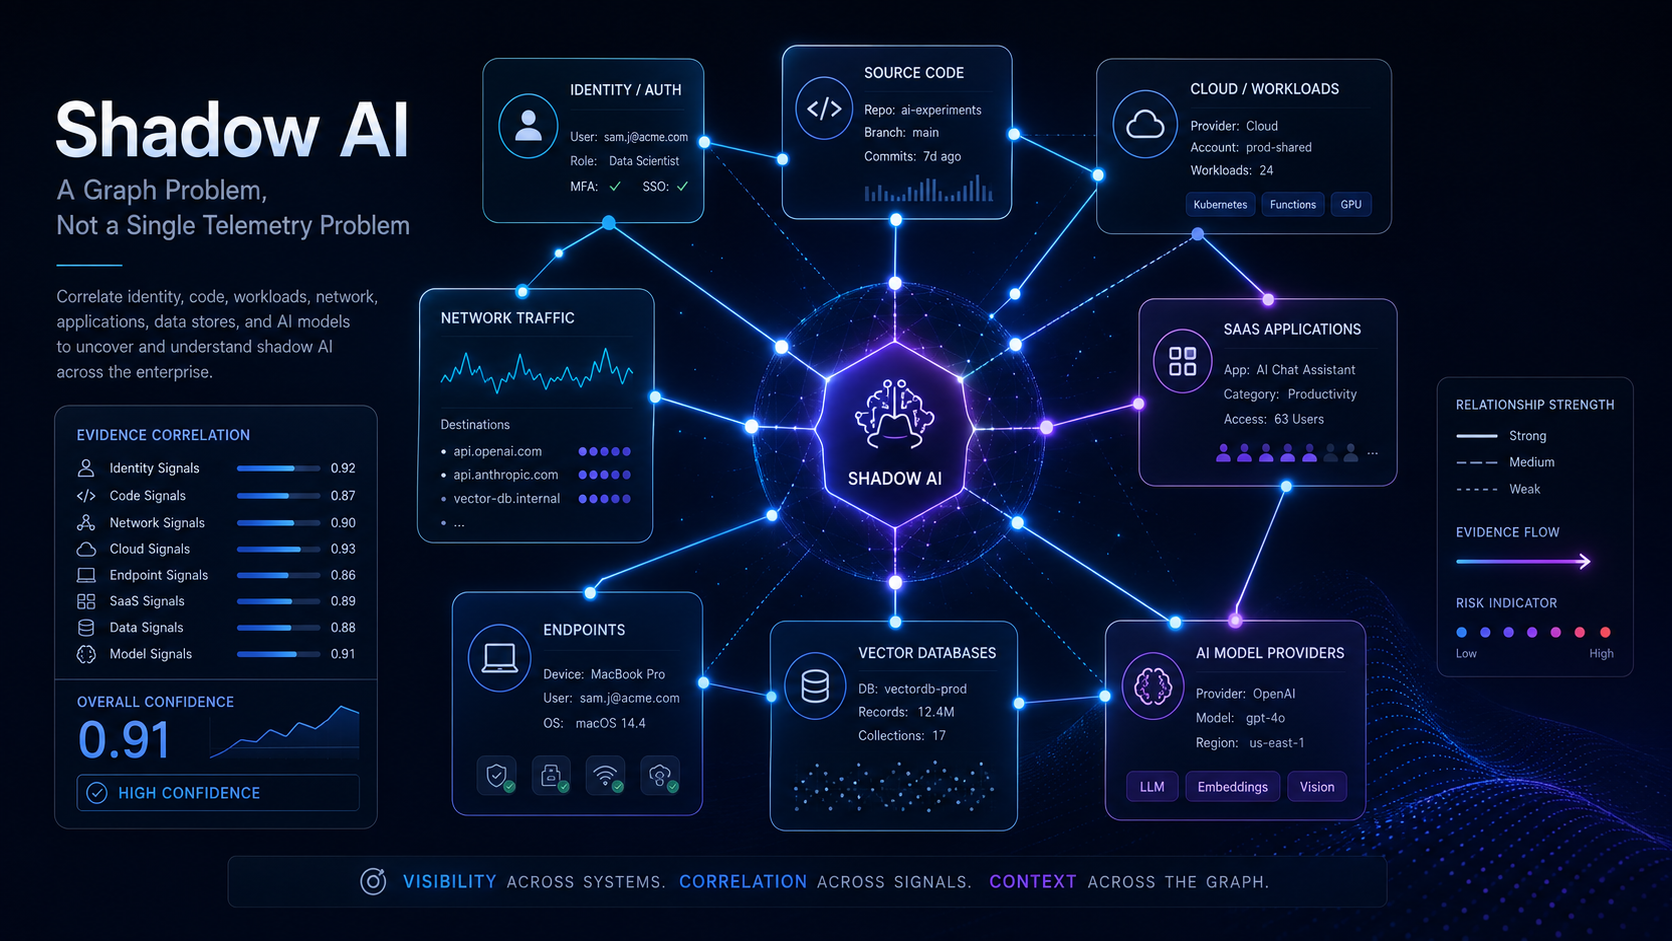
From Network Metadata To An AI Systems Graph
The most useful output is not a flat list of destinations. It is a graph:
- Source workload.
- Egress path.
- Provider or destination category.
- Timing.
- Bytes and packets.
- Data systems reached by the same source.
- Vector stores reached by the same source.
- Package or model artifact sources.
- Bedrock principals and model IDs.
- Confidence and limitations.
That graph supports questions security teams actually need to answer:
- Which teams are using AI?
- Which providers are being used?
- Which workloads bypass approved gateways?
- Which workloads combine AI with sensitive data systems?
- Which workloads look like RAG systems?
- Which workloads look agentic?
- Which internal services may be model gateways?
- Where do we need better logging?
The goal is not to perfectly infer every model from network metadata. The goal is to make AI behavior visible enough to prioritize validation and controls.
Controls And Follow-Up
Common follow-up actions include:
- Enable Route 53 Resolver query logs.
- Use one-minute flow-log aggregation.
- Add packet source and packet destination fields.
- Enrich ENIs with service, owner, repo, and environment tags.
- Centralize AI egress through an approved gateway.
- Log Bedrock model invocation details.
- Add proxy or gateway logging for SaaS model providers.
- Inventory vector stores and internal inference services.
- Monitor first-seen AI destinations.
- Alert on approved-gateway bypass.
- Review workloads that combine AI egress with sensitive data access.
VPC Flow Logs do not replace application telemetry. They give MDR teams a broad, hard-to-avoid network view that can discover runtime AI paths even when the application team has not yet documented them.
That is the value of treating flow logs as part of a shadow-AI discovery program: they turn network metadata into an actionable AI usage map.
Series Navigation
Previous: Part 2